Bitumen Fatigue Test: Ensuring Pavement Longevity
Bitumen fatigue test is crucial for predicting long-term pavement performance. Understanding how asphalt mixtures respond to repeated loading is paramount for infrastructure durability. This article, brought to you by Gulf Petro Vision, delves into the intricacies of bitumen fatigue, exploring testing methods, failure mechanisms, and the impact of modifiers on performance. We aim to provide actionable insights for professionals in pavement engineering.
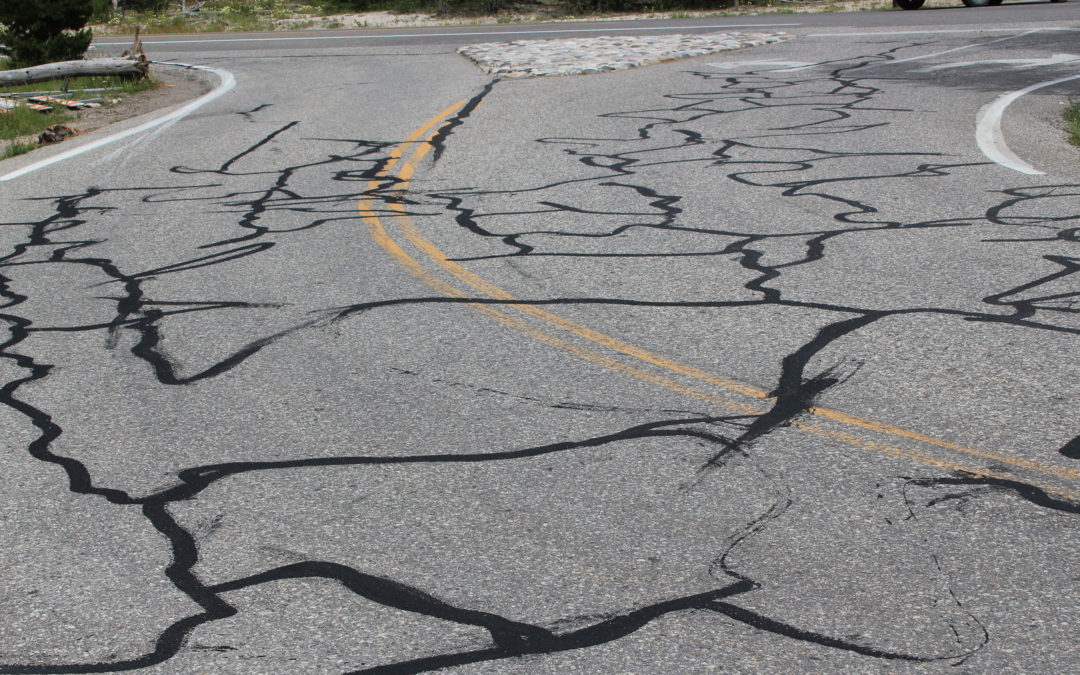
What Is Fatigue in Asphalt Pavements and Why Does It Matter?
Fatigue in the context of asphalt pavements refers to the progressive loss of stiffness and the formation of micro‑cracks caused by millions of traffic load repetitions. Each axle pass imposes a tensile strain on the binder film; over time these strains accumulate, producing localized cracking that eventually links into a visible fault. Understanding this phenomenon is essential for pavement longevity because fatigue‑driven cracking dominates maintenance costs on high‑traffic routes.
How Does the Bitumen Fatigue Test Reveal Strain Fatigue Under Repeated Loads?
The bitumen fatigue test subjects a compacted asphalt specimen to cyclic loading while monitoring strain, stress, and the number of cycles to failure. By controlling either the applied strain (controlled‑strain) or the stress level (controlled‑stress), engineers can directly quantify the binder’s ability to resist strain fatigue. Key outputs include the fatigue life (Nf) and the corresponding stress or strain range, which feed into predictive models for field performance.
Which Repeated Load Asphalt Testing Methods Are Used to Measure Bitumen Strain Fatigue?
Two primary approaches dominate laboratory bitumen fatigue analysis:
- Controlled‑Strain Testing (ASTM D6931) – the specimen is deformed to a preset strain amplitude, and the resulting stress response is recorded.
- Controlled‑Stress Testing (ASTM D1754) – a constant stress level is applied, and the accumulated strain is measured until failure.
Both methods capture the essential parameters—stress, strain, and cycles to failure—that define the fatigue behavior of the binder and the mixture.
What Role Do S‑N Curves Play in Predicting the Fatigue Life of Asphalt Mixtures?
S‑N curves (stress‑vs‑number of cycles) are constructed from repeated‑load data. By fitting a power‑law relationship (σ = A·N-b), engineers can extrapolate the fatigue life for service stress levels that are difficult to test directly. These curves become the backbone of pavement design software, linking laboratory results to long‑term pavement durability.
How Do Temperature and Loading Frequency Influence Fatigue Performance?
Temperature governs binder viscosity: at high temperatures the binder softens, reducing fatigue resistance, while low temperatures increase brittleness, accelerating crack initiation. Loading frequency interacts with temperature through the viscoelastic time‑temperature superposition principle; higher frequencies simulate colder conditions, shifting the S‑N curve leftward. Consequently, fatigue testing must span a realistic temperature‑frequency envelope to capture field behavior.
Illustrative S‑N relationship derived from controlled‑stress testing.
For a deeper dive into related testing protocols, see Bitumen Tests: A Comprehensive Guide, which outlines additional asphalt fatigue testing methods and emerging standards for 2026.
Why Is the Bitumen Fatigue Test Critical for Pavement Longevity?
The bitumen fatigue test quantifies how repeated tensile strains degrade binder stiffness, directly influencing the fatigue life of asphalt mixtures. By linking laboratory results to Bitumen Tests: A Comprehensive Guide, engineers can anticipate cracking resistance and plan maintenance cycles.
What Is the AASHTO PP‑63‑21 Bitumen Fatigue Test and How Is It Conducted?
AASHTO PP‑63‑21 employs an indirect tensile setup on cylindrical specimens (101 mm × 63 mm). Samples are conditioned at 25 °C, then loaded cyclically at 10 Hz with a stress ratio of 0.5. Fatigue life (Nf) is recorded when the specimen fails to sustain 50 % of its initial load. Data analysis follows a power‑law relationship (Nf = k·σ^−n) to derive the fatigue equation.
How Does the ASTM D8225 Bitumen Fatigue Test Differ from the AASHTO Method?
ASTM D8225 introduces multiple stress levels (low, medium, high) on small beam specimens (25 mm × 12.5 mm × 75 mm). It uses a sinusoidal load at 5 Hz and captures strain via extensometers, enabling a visco‑elastic continuum damage (VECD) model. This provides a more nuanced view of binder degradation across a range of stresses, though sample preparation is more labor‑intensive.
Comparison of average fatigue lives measured by the two standards.
What Quality‑Control Measures Ensure Reliable Fatigue Data?
Key steps include precise temperature control (±0.5 °C), repeatable specimen compaction, and calibration of load cells before each test batch. Recording baseline stiffness values allows post‑test verification of data integrity.
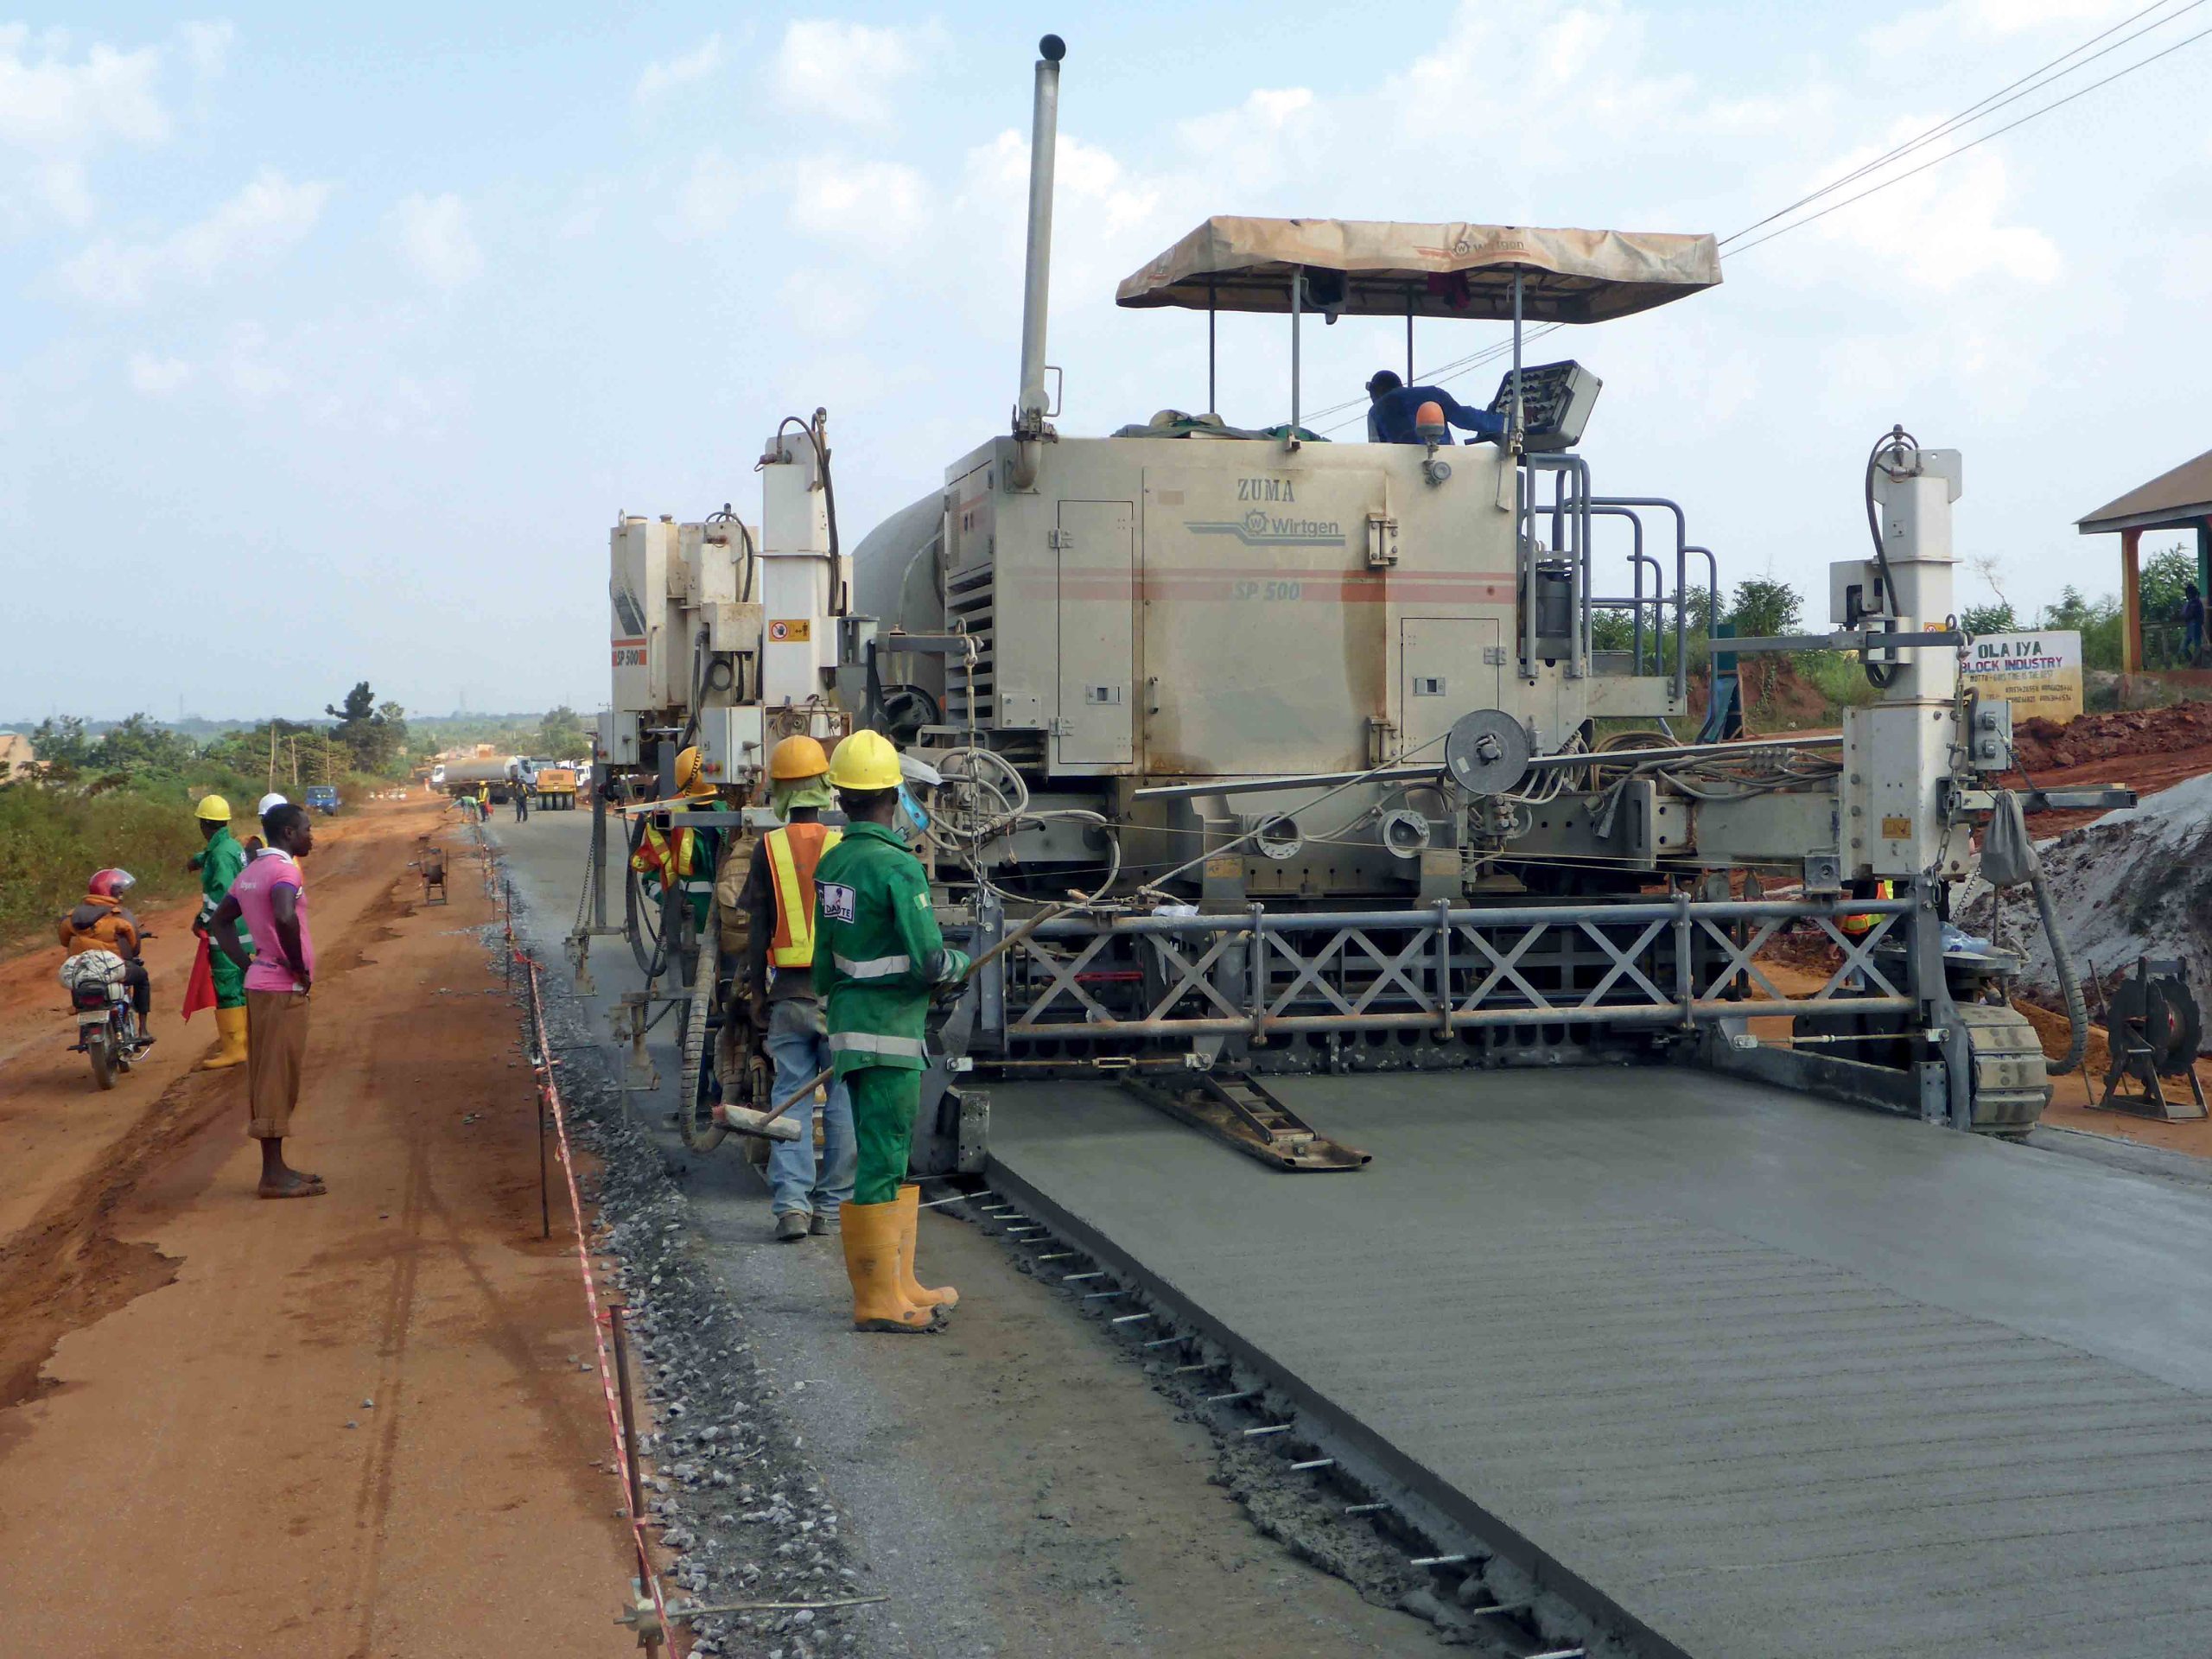
How Will Bitumen Fatigue Testing Evolve by 2026?
Emerging protocols integrate VECD modeling with AI‑driven pattern recognition to predict long‑term pavement performance. Hybrid testing rigs now combine repeated‑load asphalt testing with real‑time strain mapping, offering a pathway toward advanced bitumen fatigue assessment that accommodates modifiers and recycled materials.
Modifiers such as polymers, fibers, and crumb‑rubber are routinely added to asphalt binders to extend pavement service life. By altering the viscoelastic response of the bitumen, these additives directly influence the fatigue behavior of the resulting mixture, delaying crack initiation and slowing propagation under repeated traffic loads.
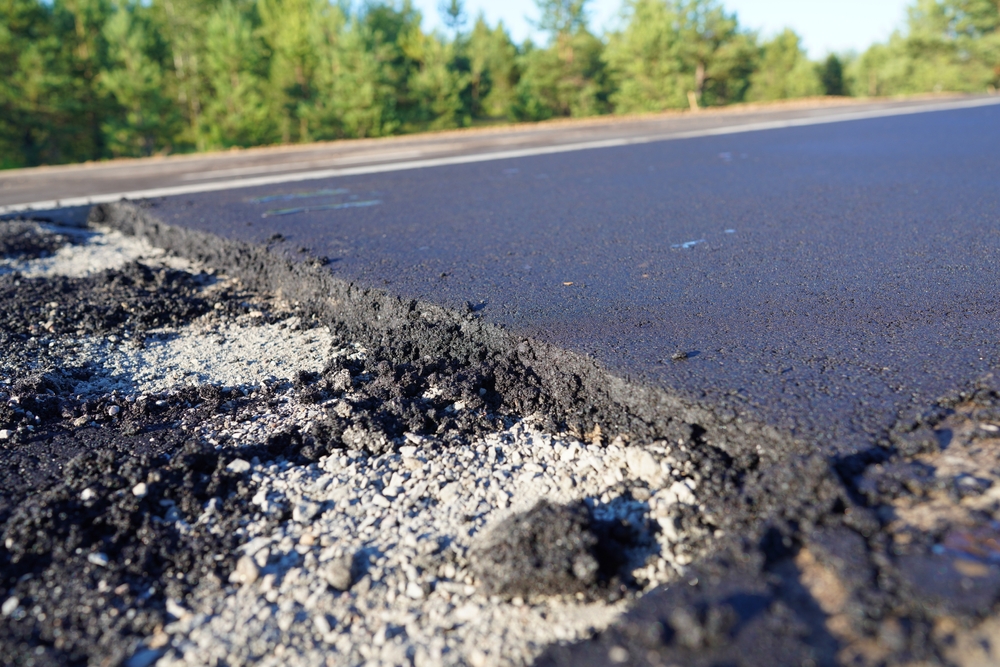
How do different modifiers change the fatigue life of asphalt mixtures?
Polymeric modifiers (e.g., SBS, EVA) increase the elastic modulus at low temperatures while preserving sufficient ductility at high temperatures, creating a “toughened” binder that absorbs more energy before a fatigue crack forms. Fibrous additives (e.g., polyester, basalt) create a three‑dimensional reinforcement network that bridges micro‑cracks, improving crack‑initiation resistance. Crumb rubber, derived from end‑of‑life tires, introduces a rubbery phase that enhances strain tolerance and reduces stiffness variation with temperature, thereby improving the bitumen tests: a comprehensive guide insights on bitumen cracking resistance. These mechanisms collectively raise the fatigue life of the asphalt mixture, often measured in millions of load cycles.
What does a bitumen fatigue test reveal about modified binders?
Typical S‑N curves illustrate that rubber‑modified binders often achieve the highest fatigue endurance.
Why is interpreting fatigue data from modified mixtures challenging?
Modifiers shift the S‑N curve shape and alter the strain‑fatigue relationship, making standard fatigue testing standards for bitumen less directly applicable. Laboratory bitumen fatigue analysis must therefore account for temperature‑dependent modulus changes, strain‑rate effects, and the interaction between binder and aggregate skeleton. Advanced bitumen fatigue assessment techniques—such as time‑temperature superposition coupled with digital image correlation—help isolate the true contribution of each modifier, but they demand higher expertise and more elaborate data processing.
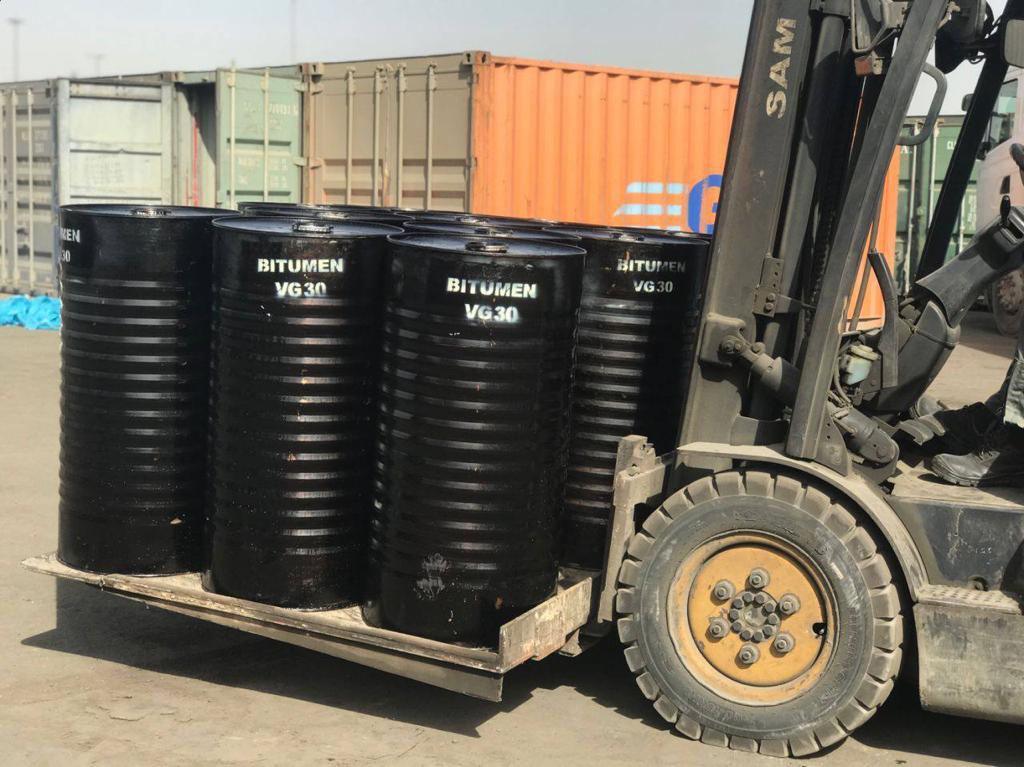
Accurate interpretation of test results informs long‑term pavement performance fatigue predictions, guiding selection of the most effective modifier blend for a given climate and traffic regime.
Accurate assessment through a bitumen fatigue test is vital for designing durable and cost-effective pavements. From standardized testing procedures to advanced analysis techniques, understanding fatigue behavior is key to mitigating cracking and extending service life. Gulf Petro Vision remains committed to providing high-quality bitumen and supporting advancements in pavement technology. Explore our range of bitumen grades and contact us for expert consultation.