Viscosity Grade Bitumen: A Complete Guide
Viscosity grade bitumen is a critical factor in asphalt performance, directly impacting road durability and longevity. Selecting the correct viscosity grade is paramount for ensuring optimal pavement performance across varying climates and traffic loads. At Gulf Petro Vision, we specialize in providing a comprehensive range of bitumen grades tailored to meet diverse industry needs, backed by expert analysis and market insights.
How Does the Bitumen Grading Influence Viscosity Grade Selection?
The global market relies on three principal grading approaches: penetration grading, viscosity grading, and the Performance Grade (PG) system. Penetration grading classifies binders by the depth (in 0.1 mm) a standard needle penetrates under 25 °C, indirectly reflecting viscosity—softer binders (higher penetration) exhibit lower kinematic viscosity. Viscosity grading measures the binder’s flow resistance at 60 °C (in cSt), offering a direct link to workability during mixing and compaction. The PG system, introduced by the Asphalt Institute, combines temperature susceptibility and aging performance, assigning a binder a notation such as PG 64‑22 that indicates it must retain ≥3 % penetration at 64 °C and withstand 22 °C aging.
What Correlation Exists Between Penetration, Kinematic Viscosity, and PG Designations?
Empirical charts show that a 30 penetration binder typically has a 60 °C viscosity of 180–210 cSt, whereas a 70 penetration binder falls near 120–150 cSt. The PG label consolidates these trends: a PG 58‑28 binder usually matches a 65 penetration range with a viscosity around 150 cSt, while a PG 76‑22 binder aligns with finer penetrations (≈25) and higher viscosities (≈250 cSt). This calibrated relationship enables engineers to predict field performance from laboratory metrics.
Why Do Traditional Grading Systems Fall Short Compared to Performance Grading?
PROS
- Simple, long‑established testing methods.
- Quick classification for routine applications.
CONS
- Limited climate and traffic insight.
- Viscosity alone cannot predict long‑term rutting resistance.
The PG system incorporates both high‑temperature (rutting) and low‑temperature (thermal cracking) criteria, aligning binder choice with climate, traffic load, and design life, which is essential for meeting 2025 standards for road construction.
How Can Engineers Use a Bitumen Viscosity Chart to Optimise Binder Choice?
Typical viscosity ranges for common PG binders, illustrating the shift needed for hot‑climate versus cold‑climate projects.
Choosing the proper viscosity grade bitumen based on climate (.g., higher viscosity for hot climates, lower for cold) and traffic load reduces premature cracking and rutting, directly improving pavement durability. For more detailed guidance, consult the ASTM standards for bitumen and integrate binder viscosity testing into quality‑control protocols.
How does viscosity grade bitumen respond to temperature fluctuations?
Viscosity temperature sensitivity is the rate at which a binder’s flow resistance changes as the ambient temperature varies. In practice, a steep viscosity‑temperature curve means the binder becomes too stiff in cold weather, risking cracking, while a shallow curve preserves workability in hot climates. Selecting the appropriate Viscosity Grade Bitumen: A Complete Guide requires understanding this behavior to match the local thermal regime.
Why are cold‑climate applications more demanding for viscosity grade bitumen?
In regions where temperatures can drop below ‑10 °C, the binder must retain adequate flexibility. Low‑temperature grades (e.g., 10/30 V) are formulated to exhibit a lower viscosity index, reducing the risk of thermal cracking. Conversely, hot‑climate projects benefit from higher‑temperature grades that maintain strength at 60 °C or above, preventing rutting under heavy loads.

What role does crude oil source and refining play in temperature sensitivity?
Bitumen derived from heavy, sulfur‑rich crude typically shows higher temperature susceptibility than light, paraffinic feedstocks. Refining processes such as vacuum distillation and deasphalting can adjust the aromatic‑to‑naphthenic balance, directly influencing the viscosity‑temperature curve. Producers often blend fractions to achieve a target Temperature Susceptibility Parameter (TSP), defined as the slope of the log‑viscosity versus temperature plot.
Typical TSP curve illustrating how viscosity drops with rising temperature.
How is temperature sensitivity measured and reported?
Laboratories compute the Temperature Susceptibility Parameter (TSP) from a series of viscosity tests (e.g., Rotational Viscometer) across a temperature range of –10 °C to 60 °C. The resulting log‑viscosity versus temperature plot yields a slope; a lower slope indicates reduced sensitivity. This metric is now part of the ASTM standards for bitumen testing.
Can polymer modification reduce viscosity temperature sensitivity?
Adding elastomers such as SBS (styrene‑butadiene‑styrene) or EVA (ethylene‑vinyl acetate) creates polymer‑modified bitumen (PMB). PMBs display a flatter viscosity‑temperature curve, offering higher low‑temperature flexibility and high‑temperature stiffness simultaneously. For example, a 5 % SBS‑PMB may show a TSP reduction from 0.85 log cP/°C to 0.45 log cP/°C, extending service life in both cold and hot zones.
What changes are expected in bitumen viscosity specifications for 2025?
Industry consensus anticipates tighter limits on the viscosity index for all performance grades, particularly for high‑traffic highways. The upcoming 2025 standards will likely mandate a maximum TSP of 0.60 log cP/°C for PG 64‑22 binders, compelling wider adoption of PMB technologies and more rigorous source blending strategies.
Why is Bitumen Viscosity Testing Crucial for Durability & Troubleshooting?
How does accurate viscosity testing protect pavement durability?
Viscosity governs the binder’s flow at mixing and compaction temperatures, directly influencing film thickness, aggregate coating, and ultimately the resistance to cracking, rutting, and fatigue. When the viscosity grade bitumen matches the design temperature window, the comprehensive guide on bitumen grading systems shows a measurable rise in the bitumen viscosity index, a predictor of long‑term performance. Deviations can cause premature stiffening or softening, undermining the pavement’s structural integrity.
What are the main viscosity testing methods for viscosity grade bitumen?
Two standard techniques dominate the industry:
- Rotational viscometers – measure torque required to rotate a spindle at a fixed speed (ASTM D4402). They provide a quick viscosity value at the target temperature.
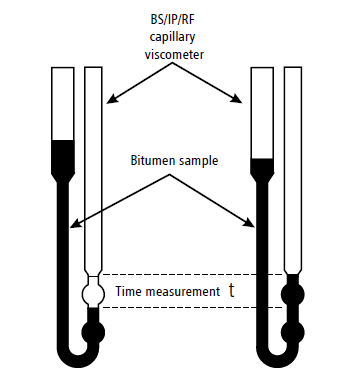
- Capillary viscometers – determine the time a known volume of bitumen flows through a calibrated tube, offering high precision for low‑viscosity binders.
Both methods obey the principle that viscosity is a function of shear stress and shear rate, but the rotational test is preferred on‑site for its speed.
Which quality‑control checkpoints rely on bitumen viscosity testing?
Quality control integrates viscosity checks at three critical stages:
- Incoming bitumen delivery – verifies compliance with bitumen viscosity specifications.
- Mix plant storage – monitors temperature‑viscosity sensitivity to prevent oxidative hardening.
- Post‑compaction sampling – confirms the binder retained the designed optimal bitumen viscosity after mixing.
These checkpoints ensure that every batch meets the bitumen performance grade (PG) viscosity requirements.

How can we troubleshoot inconsistent test results?
Use the following quick‑diagnostic flow:
- Check thermometer calibration – temperature errors skew viscosity by up to 10 %.
- Inspect sample homogeneity – air bubbles or insufficient stirring cause erratic readings.
- Verify instrument cleaning – residual binder alters torque measurements.
- Compare results against a ASTM rotational viscometer standard chart to spot outliers.
Typical viscosity curve for a PG 64‑22 binder.
By integrating rigorous viscosity testing into every production step, engineers can fine‑tune the bitumen viscosity chart, select the proper viscosity grade selection, and achieve a pavement that withstands climate stresses while meeting the 2025 standards for durability.
Successfully navigating the complexities of viscosity grade bitumen requires a thorough understanding of grading systems and performance parameters. Optimizing binder viscosity is essential for achieving durable, long-lasting road infrastructure, especially as standards evolve towards 2025. Gulf Petro Vision remains committed to providing the expertise and quality products needed for success in the petrochemical industry. Contact us today to discuss your specific bitumen requirements.